Category Archives: weather

New terminology for an old excuse

5:30 P.M. Sat., Feb. 5, 2022

Got a good laugh from this morning’s CJ.  When asked by a reporter, “What happened to the big ice storm?, a National Weather Service forecaster replied that the storm had “underachieved.”   Essentially saying that our forecast was correct and nature was wrong.  Give me a break.

A little background

When I arrived in Louisville in 1969, I heard many stories about a long-time Head of the local “Weather Bureau”, as many people called it back then. O. K. Anderson was his name and he was closely associated with phrases like, “It was coming our way, then this darned Ohio Valley changed its path and ruined everything.”  “This darned Ohio Valley” got blamed for all the missed forecasts.

He was correct, the Ohio Valley does alter weather systems.  My reasoning, however, was that the Ohio Valley has been basically the same for thousands of years.  Shouldn’t it always alter weather patterns the same way?

It took several years (and some pretty bad forecasts), to start seeing patterns of behavior difference between the forecast models and reality.  After awhile, I developed enough confidence to actually use those observed differences in my forecasts.  What an improvement that made.

But, back to my original point.  Over many years, forecasting improved a good bit but winter storms still were the source of quite a few “misses.”  And snow and ice forecasts were far more noticeable than anything else.  It’s like this:  if you forecast rain, it doesn’t really matter whether it rains .1″ or 1″,  it still “rains.”  But if you predict one inch of snow and you get 10″, everybody notices.

When forecasts didn’t pan out, I kept hearing two specific phrases.  “We got lucky” and “We dodged the bullet”  are still used regularly.  I’ve been telling people for decades, if you hear either one of those phrases, what they are actually saying is, “I was wrong.”

So, we’re back to 2022 and we have a new entry to our list of excuses.  At least twice this winter I’ve read from the NWS, a storm underachieved.  So now, you can blame a missed forecast on “the Ohio Valley”, “we were lucky”, “we dodged the bullet” or “the storm underachieved.”  Any way you say it, it means “I blew it.”

Note 1:  We’re all human.  We all make mistakes.  Some people just can’t admit it.

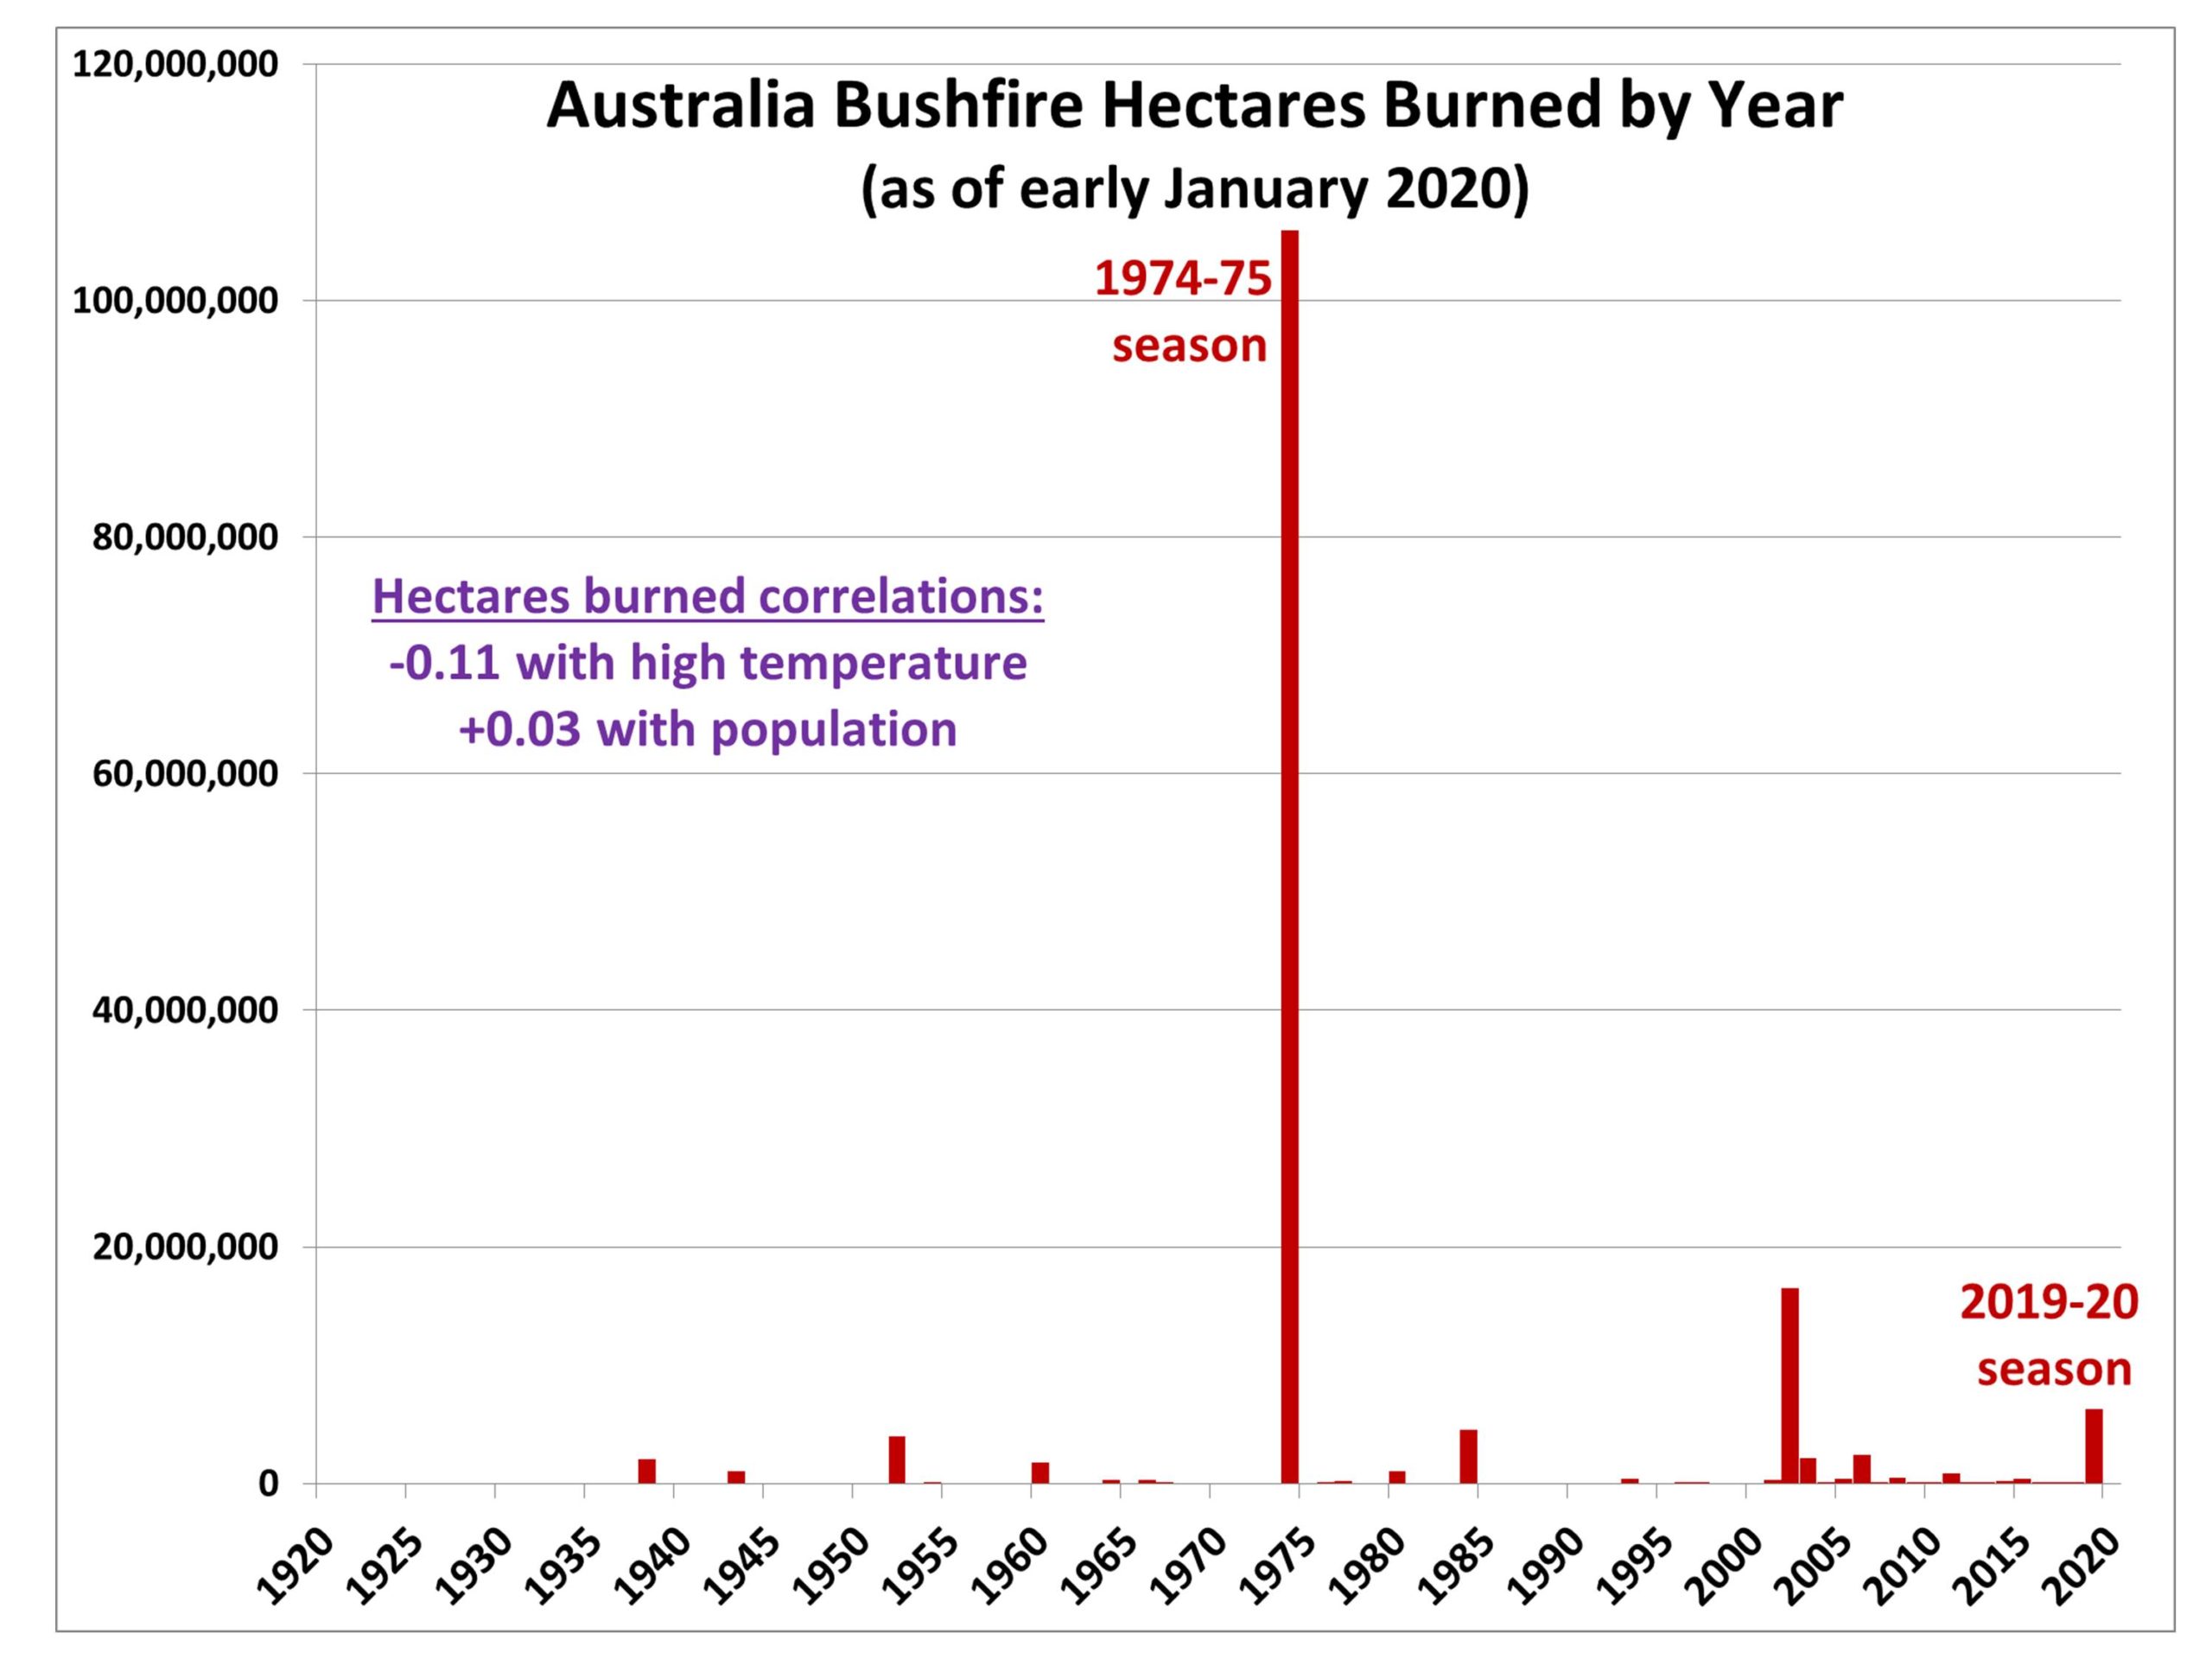
Note 2:  This is exactly the same reason that has brought us the so-called “climate crisis.”

Huh?

Wednesday, June 10, 2020

Latest NWS forecast reads like this:

Detailed forecast for

Jefferson County

Late This Afternoon
Breezy. Partly cloudy. Slight chance of showers and thunderstorms early in the evening. Some thunderstorms may be severe with damaging winds and large hail early in the afternoon. Southwest winds 15 to 25 mph. Chance of precipitation 20 percent.
It is confusing, at the least.
Missed opportunit
Although we did see some showers yesterday, rain totals were small.  Today’s missed opportunity was our last chance for awhile, and that’s bad news.
 A strong upper air ridge will be building over the mid U.S. and will provide a long stretch of dry weather.  Temperatures are expected  to remain near-to-below normal, so it won’t be heat wave conditions,  but the ground will be drained of moisture quickly.  Early in the growing season is a bad time to have a dry spell because dry areas tend to feed on lack of moisture and grow.  Normally, summers tend to get drier as we get into July and August.  That usually bodes poorly for the growing season.  If these trends continue, we could be in for a hot, dry late summer.
Stuff
1).  Coronavirus  cases in the U.S. are growing again as we reopen.  However, deaths from the virus are continuing to fall – about 1000 per day lately.  Seems like the older generation (people like me) is sticking by the masks and quarantining while the younger ones are less severely ill from the virus.
2). Cudos to our Prevaricator In Chief.    Must give credit where its due.  When he ran for President, Mr. Trump  (PIC) ran on two big issues.  1).  Build a wall.  2).  Make America Great Again.  Well, he has succeeded at both.  First, he imagined a great wall to keep the “good guys” (us) in while keeping the bad guys (Latin Americans) out.  He got his wall, but it didn’t quite work out as he imagined.  Instead, the much smaller wall around the White House is designed to keep the good guys (concerned Americans) out while keeping the bad guy in – hiding in his bunker.  Yes, PIC the world is laughing – not at us, but at you.
Then there’s MAGA.  Frankly, I never quite understood this slogan.  At least for the past 200 years when compared to the rest of the world, America has always been great.  We’ve had our problems, but we’ve been slowly improving over time.  But, when faced with a crisis, our PIC has really come through.  Yes, we’re NUMBER 1 – in a big way!  By huge margins,  we lead the world in coronavirus cases and fatalities!  Yes, we are NUMBER 1.

Winter’s return still on target

Wed, Jan. 15, 2020

This morning’s showers surprised me as I thought the return to warm air would be dry.  But the yoyo weather will continue – warm today, colder tomorrow, and warmer with periods of rain Fri/Sat.  Then, Sunday wintry weather arrives.  We’ll see below normal temperatures for at least a couple of weeks.  The GFS has lost the weak clipper system it was earlier predicting for Tuesday night. Now it’s developing a snow to rain event for Wednesday night and Thursday.  Updates will follow.

Australian Fires

Due to geographical location, global wind patterns and ocean currents, the West Coast of North America and the East Coast of Australia are both prone to seasonal forest fires.  This is nothing new – it’s been going on for thousands of years.  Many are putting the blame for this year’s higher than normal fire destruction on “climate change.”  Good try, but climate change has been going on forever, just like the fires.  Might other things be involved?   Of course.

1).  Forest maintenance –  Like the U.S., Australia bans removal of undergrowth from forest floors.  Undergrowth removal eliminates the majority of the fuel for fire growth and rapid spread.  Seems to me that undergrowth removal should be priority #1.  But, it’s banned.  The result is more fires, much more land burned, rapid spread of fires, more wildlife and human deaths…   (But, it keeps some environmentalists happy.)

2).  Population – Since 1950 Australia’s population has jumped from around 8 million to about 25 million today.  As in the U.S., Australians have built many homes in forested areas amplifying the potential death and damage fires can create.

3).  Humans-  So, we’ve got forests primed to ignite, and many more people living in them.  Then you add in the fact that humans are pretty careless.  In the U.S., an estimated 85% of all forest fires are caused by humans.  I’m guessing it’s about the same down under.

4).  Malicious humans.  A large number of forest fires are intentionally started by arsonists.  U.S. numbers say 21% of our forest fires are arson.  As of yesterday, about 155 people have been arrested on arson charges in Australia.  An additional (approximately) 300 have been arrested for fire-related offenses.

Forest fires have been occurring for as long as Mother Earth has had forests.  Climate change has been happening even longer than that.  But, since we homo sapiens arrived about 200,000 years ago, life for forests has become much more hazardous.

Note: The graph below portrays the areal coverage of Australian fire damage for the past 100 years.  This year  (so far) ranks #3, but 1975 was ten times higher than this year!

Note 2: In 1975 the big climate issue was global cooling and the beginning of the next Ice Age.  So, I wonder if that year’s fires were blamed on that.

Note 3:  One hectare equals 2.47 acres.

Fig. 1. Yearly fire season (June through May) hectares burned by major bushfires in Australia since the 1919-20 season (2019-20 season total is as of January 7, 2020).

The little engine that could

Tuesday, January 16, 2018  3 P.M.

The relatively small weather system that moved ever so slowly over southern IN and KY yesterday was amazing to watch.  It just didn’t want to move in spite of the models efforts to move it away last evening.  Watching the snow pattern move across the radar screen last night was like watching the proverbial paint dry.  In spite of the prolonged period of snow, the system still couldn’t generate much snow, but it was an amazing effort.

The last very cold surge (for at least two weeks) of Arctic air has arrived and will dominate our weather for the next two days.  We’re seeing a good example of the power of the sun this afternoon.  The air temperature is only in the mid teens but yet we’re getting a lot of melting on asphalt roads.  Concrete roads don’t absorb as much heat, so they haven’t melted as much snow.

By all large scale features, we should be having temperatures at zero or below tonight.  The coldest part of the cold air mass will be over us tonight,  we have a snow cover, clear skies and light winds.  That normally would produce temperatures in the 0 to -10 range.  However, model and human forecasts are predicting a low range of 5 to 10 degrees. Why?  Lake Effect

We normally think of snow when Lake Effect is mentioned.  Not this time.  This is more subtle.  The model suite is in agreement that low level winds (3,000 to 8,000 feet) will develop a fetch (flow pattern) from Lake Michigan SSE across IN and into the eastern half of KY.  It’s too weak to produce snow, but it should be able to produce mostly cloudy skies after midnight.  The clouds trap what little heat we have so our temperatures stay higher.  (Skies should remain mostly clear 30-40 miles west of Louisville, so sub zero temperatures are likely there.)

The ability of today’s weather forecast models to pick up on such small details as a Lake Effect’s ability to alter our weather (hundreds of miles away)  is really amazing.  We’re light years ahead of the two primitive models I started using more than 50 years ago.


Observations from this week’s snows

Thursday, Jan.14, 2016

The two snows this week pointed out a couple of interesting items: (1) The time and temperature that snow falls is very important and (2) the difference between “snowfall” and “snow accumulation.”

First, according to airport (SDF) data, the two systems had approximately the same liquid water content, so all things being equal we should have had about the same results.  But, we certainly didn’t.  Sunday’s snow fell during rapidly falling temperatures (from above freezing into the 20’s.  The warmer roads, at first, melted the snow.  As it got colder, the roads froze into icy sheets with a thin layer  of snow on top.  Meanwhile, the snow which fell onto the grassy areas didn’t melt (because of no solar radiation at night) and accumulated up to around an inch locally. If that snow had fallen during the day, the result would have been much like what we saw Tuesday.

Tuesday’s snow arrived around daybreak, so it didn’t have the advantage of night to get a jump on accumulations.  Plus temperatures were above 32 degrees.  That snow continued most of the morning, including a strong snow shower around 11 A.M.  That snow shower, if it had occurred around, say, 6 or 7 A.M., would have created a huge mess on the roads.  But, it happened during the day and the roads just stayed wet.

Now, the snowfall vs. accumulation.  This can be confusing because when we forecast snow, we talk about the expected accumulation – how much will my ruler measure on a flat, NON grassy surface.  However, the National Weather Service reports two measurements- snowfall and snow accumulation.  As we saw this week, the two are NOT the same.

Sunday morning’s snow (at night) was right in line with expectations – the weather service reported .8″ of snowfall and 1″ on the ground.  Accumulations are rounded to the nearest inch, so a measured “on the ground” .5″ to 1.4″ would be reported as 1″, etc.

Tuesday, however, was a much different story.  The “official” snow on the ground at 7 A.M. was 1″.  Then came the snow.  It was daytime and temperatures were above 32.  The snow”fall” total reported by the NWS was 1.8″.  At 1 P.M. the officially reported accumulation on the ground was listed as 0.

Good illustration of the difference between snowfall and snow accumulation – we started with one inch on the ground, then a snowfall of 1.8″.  After it was over, we had less than a half inch of snow on the ground.

NOTE:  Situations like this allow almost everybody to proclaim a “correct” forecast.  Monday night, the NWS and many others forecast an accumulation of 1″-2″.  I wasn’t watching Tuesday evening, but based on past experiences, I’d say that a common comment went something like this…”just like we predicted, we had 1.8″ of snowfall…”  They may proclaim to be “correct”, but they were wrong!  And they are trying to convince you they were right.  So, if you are keeping score – give them two strikes instead of one.

There is a difference between snowfall and snow accumulation. although many times forecasters wish you didn’t know.


NOTE:  I don’t know why, but this post today brought to mind an old story circulating about our old “climate specialist” Al Gore.  As you probably know, back in 2007 or so, Al famously announced to the world that due to global warming,  the Arctic would be ice-free (In summer) and the polar bears would have vanished by 2013 or 2014.  Well, here we are in 2016 and the Arctic still has plenty of ice and polar bears.

The comment:  When Al Gore was born, Earth had 7000 polar bears.  Now there are only 30,000 left.


Brief showers

Thursday afternoon

A line of light showers moving through the afternoon won’t last very long.  We seem to find ourselves in the wrong spot at the wrong time situation.  A look at the satellite image belowvissatshows two lines of clouds with light showers being produced by a weak cold front pushing southward.  These showers will fade before sundown, but the cooler air will reinforce the pleasant, dry air mass we’ve been enjoying.  (By the way, good call by the National Weather Service to add in that chance for showers this afternoon.

If you look to the upper-center( Iowa, Minnesota and South Dakota) of the image you will see the classic satellite view of an upper level disturbance.  This one will drop slowly southeast and bring us increasing cloudiness by late tomorrow.  As the system crosses north of us on Saturday, we’ll see a lot of clouds (with a small chance for some light showers) early in the day, The primary effect this system will have on us will be to bring in much higher humidity.  Then, as skies clear Saturday afternoon, We’ll really know that summer’s definitely not finished.  Once the humidity  is in place all we have to do is wait.  A few more of those upper air disturbances are expected to follow the one on the satellite image above.  Some periods of showers/thunderstorms should become more likely, perhaps early Sunday, but a better chance late Sunday and Monday.


Changes coming from the Storm Prediction Center

For years we’ve been receiving “Severe Storm Outlooks” from the Storm Prediction Center with three familiar categories – Slight Risk, Moderate Risk and High Risk.  These Convective Outlooks, as they are officially known, appear as maps showing locations where the forecasters expected the possibility for thunderstorms that day and pinpoint areas where they believe severe storms are possible.  The slight, moderate and high risk delineate areas based on the expectations where the most widespread and intense severe storms will be located.

That system will end October 22.  The types of outlooks will grow to five with the addition of “marginal” and “enhanced”.  It is very hard for a forecaster to just draw a line separating expected non-severe and severe regions.  It’s my belief that most of the time, SPC forecasters use the “better safe than sorry” philosophy.  As a result, I believe that in general practice the daily “Slight Risk” category is considerably larger than it should be.  So, I’m happy to see the addition of the Marginal Risk category.  This should eliminate the problems with the lower end of the storm spectrum and ease the worry many people have when they hear “Slight Risk” in the morning.

The “Enhanced Risk”  category covers the border between Slight and Moderate, also a   confusing boundary.  The jump from slight to moderate currently means higher areal coverage AND more numerous and intense storms (over a 10,000 square mile area, say).  Nature doesn’t always cooperate, however, especially when you have two specific criteria to satisfy.  For instance, suppose the area to be hit exceeds the “slight” criteria, but the storms aren’t expected to exceed low-level severe?  Or, vice-versa?   Enter “Enhanced Risk” for that “fuzzy”  zone.  Here’s an example of what it will look like.spcoutlooks


As humidity grows, so does the chance for rain.

Wednesday morning

Little change from yesterday except the humidity has finally reached uncomfortable levels again.  So, with higher humidity to work with we have to start taking those ever present “rain chances” a bit more seriously.  But it takes more than heat and humidity to make it rain.  The upper level wind patterns have a lot to say about it as well.  For instance, yesterday we had a weak upper air disturbance pass over – plenty of clouds, but the lower atmosphere was so dry that rain didn’t form.  A similar disturbance today, would probably bring us some rain.  So, now that the surface air is “primed” the upper air energy becomes critical.

In general, the models seem pretty consistent with their placement of the next several of these minor upper disturbances.  However, the timing does vary.  Trying to make some sense out of this for Louisville’s weather, I think it’ll come down to something like this…

This afternoon: Partly cloudy and muggy…upper 80’s (no rain)                                                 Tonight:  Partly cloudy warm and muggy…low…72                                                          Thursday:  Partly cloudy, hot and humid…high near 90   (1st day of PGA looks good)           Then things get more complicated.  The upper air energy is expected to turn its attention toward our part of the Ohio Valley.  Now the timing becomes important.  We know how rain/storm systems tend to fade quickly after midnight and then regenerate the next afternoon.  The NAM brings the primary energy pool and chance for rain through the area during late night/morning Friday with NO afternoon regeneration here.  On the other hand, the GFS brings the energy through in two pieces.  The first pretty well matches the NAM, but the second should produce some afternoon thunderstorms.  I lean toward the GFS and expect the primary time for rain Friday to be during the afternoon.  Either way, I’d expect some rain delays during the PGA Friday.   Beyond that, it still looks likely that the weekend should remain dry.

Noctilucent clouds

Noctilucent clouds (NCL’s) are probably the rarest clouds in our atmosphere and are certainly the HIGHEST seen over Earth.  These thin, electric blue clouds are naturally seen about 30-50 miles above the Earth in polar regions during their summer seasons.  (In comparison, the tops of extremely strong thunderstorms only reach 12-13 miles high.)  They are believed to be formed as moisture condenses around “meteor dust.”  Few people have ever seen them.  The pictures below are from www.spaceweather.com  This one was taken by P.M. Heden of Sweden.  heaven_strip

We also have man-made varieties of NCLs.  This picture was taken yesterday at Cape Canaveral about an hour and a half after AsiaSat 8 telecommunications satellite was launched by a SpaceX Falcon 9 rocket.  The photographer was Mike Bartils.            nlcs_strip

Spaceweather.com  has a library of photos of NCLs if you’d like to see more.

Calm Weather Ahead

Tuesday afternoon

Cool, dry high pressure has once again moved over most of the eastern two-thirds of the U.S.  Pleasant weather today should return again tomorrow and Thursday looks pretty good as well.

deer 066deer 082

The photos above were sent by a friend who took these in the Rockies in June.  Her basic question was “What are these, I’ve never seen anything like this.”

These are some of my favorites from when I was in grad school in Colorado.  You only see them in mountainous areas.  These are officially called altocumulus lenticularus.  (higher altitude versions are called cirrocumulus lenticularus)  More common names are “lens clouds” or “cap clouds.”  Another common description is “standing wave clouds.”   The “lens” or “cap” feature is very clear on these photos.  The best example is the left side of the lower picture.  Three good ones are on the top picture…one just to the left of the tall center tree…on the left edge of the photo and a small one of the right edge.  The cause of these clouds is the barrier of the mountains.  On days when the upper level winds are generally from the west AND there is just a little moisture on the air west of the Rockies (a pretty common experience,  the air approaching the mountains between roughly 10,000 and 15,000 feet is forced to rise to get over the top of the mountain range which in Colorado is about 13,000 to 15,000 feet.  This forced rising/cooling of the air condenses moisture only at the very top of the ridges, then fades away quickly as the air descends east of the mountain crest.  This little bit of cloud formation gives the “lens” and/or “cap” nature of the clouds.  The standing wave cloud  gets its name from the observation that the clouds do not move.  You can watch them for hours and they still look the same.  In reality, the cloud is changing rapidly – constant supply of the rising and keeps building the cloud from the west while the sinking motions to the east evaporate parts of cloud trying to move off the mountain tops.  So, the clouds “appear” to stand still.

On days when the conditions are almost perfect, in addition to the clouds standing on the mountain peaks, you may see as many 1-4 additional lines of “cap” clouds standing east of the hills out on to the plains.  That’s even more spectacular!